
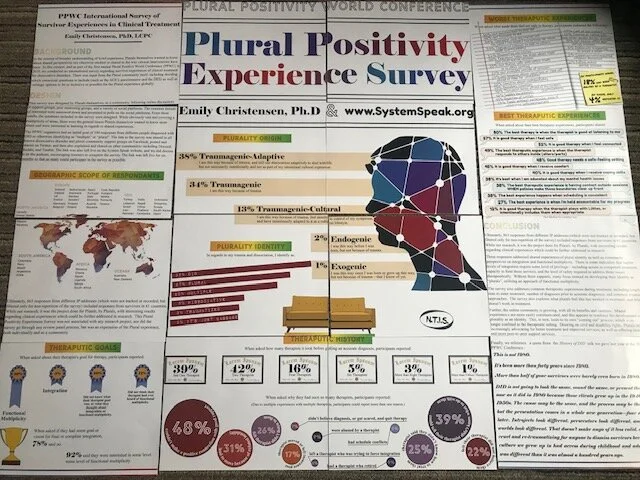
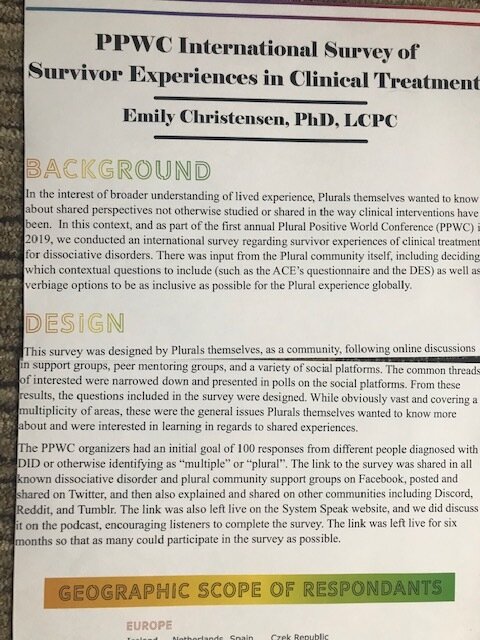
On today’s podcast, we share the PPWC Survey Results about Plural Experience, as an expression of plural culture and shared experiences. These results were accepted for a Poster Session at the 2020 ISSTD Conference in San Francisco. However, as you now know, the conference was cancelled at the last minute due to efforts of government officials’ attempts at controlling the Coronavirus through social distancing. Because we were not able to share our poster, we did take pictures of it and do share them below.
As part of the 2019 Plural Positivity World Conference (PPWC), we helped with a survey with results to be shared in 2020. This Plural Positivity Experience survey was not associated with any research project, nor did the survey go through any review panel process. There was input from the Plural community itself, including deciding which contextual questions to include (such as the ACE’s questionnaire) as well as verbiage options to be as inclusive as possible for the Plural experience. Again, this was not a research project, but was an expression of the Plural experience, both individually and as a community.
Please note:
Participants were informed that the survey results would be shared during the 2020 PPWC Conference.
To continue the survey, participants had to agree that they understood this and that they were over 18.
Any participant who did not agree to have their results shared or who were under 18 were excluded from the survey results published below.
It was explicitly stated, and participants agreed to understanding, that the questions were only for information about their experiences and not at all diagnostic in nature.
Participants were also warned that due to the nature of trauma-specific questions, they could be triggered during the survey. Resources and referrals for support were offered, and system-wide self care was encouraged before, during, and after participating in the survey.
SURVEY DESIGN
This survey was designed by plurals themselves, as a community, following online discussions in support groups, peer mentoring groups, and a variety of social platforms. The common threads of interest were narrowed down and presented in polls on the social platforms. From these results, the questions included in the survey were designed. While obviously vast and covering a multiplicity (pun intended) of areas that would be too many variables for a research project, this was again just the general areas of experience that plurals themselves wanted to know more about and were interested in learning in regards to shared experiences.
The survey was in English.
The survey took an average of 26 minutes to complete.
The first page of the survey was simply exclusionary material clarifying the purpose, concerns, and limitations of the survey. Any “no” responses exited the participant from the survey. Questions included:
I am over the age of 18.
I understand the screening tools used in this survey are for data gathering only, and not meant to be diagnostic in nature.
I understand that due to the nature of the survey in regards to trauma and dissociation, some of the questions may be triggering. I am safe and able to care for myself during and after this survey, and know where and how to seek support if I need help.
I understand I can quit this survey at any time.
I understand the data gathered from this survey is non-identifiable, and that the survey is done with SSL encryption.
I understand that the data results will be combined, and that the overall results will be shared in the Plural Positivity World Conference for plurals, by plurals. I understand that the data results will be shared with the conference via the System Speak podcast, which is a public podcast already on air. I understand that the podcast may be linked to from other blogs, YouTube Channels, and support groups online. I understand that, while this is not an official research project, the clinical community as a whole may have access to these results generally and the related non-identifiable data.
I understand these things and consent to this survey.
The second page of the survey were demographics, including country, identified gender, body age, levels of education for self and each parent. It also included context questions regarding perception of trauma impact on education, frequented online resources, government assistance, housing stability, and patterns of sleeping, eating, and exercise.
The third page of the survey were the questions from the Dissociative Experiences Scale, again clarified that this was for appropriateness of the survey and not for diagnostic purposes.
The fourth page of the survey were the ACE (Adverse Childhood Experiences) questions.
The fifth page of the survey was about therapeutic experiences, including: number of therapists prior to diagnosis, number of therapists since diagnosis, reasons for changing therapists, current reported diagnosis, ritual abuse identification, how therapy is paid for, positive and negative experiences with therapists, what does and does not feel safe in therapy, misdiagnosis experiences, treatment goals, and integration perspectives.
The final page of the survey was cultural, about the personal experiences and identification of or with the integration process and views on functional multiplicity.
There were no research analyses done with the data, beyond the collective-per-question results shared below, or any correlation conclusions drawn from this survey due to this not being an actual research project and other obvious limitations to this survey.
That said, we do believe it to be informational about the common experiences of the Plural community as a whole, and that the survey could be informational upon reflection when considering future clinical studies.

SURVEY PARTICIPATION
The PPWC organizers had an initial goal of 100 responses from different people diagnosed with DID or otherwise identifying as “multiple” or “plural”.
The link to the survey was shared in all known dissociative disorder and plural community support groups on Facebook, posted and shared on Twitter, and then also explained and shared on other communities including Discord, Reddit, and Tumblr.
The link was also left live on this website, and we did discuss it on the podcast.
The link was left live for six months so that as many could participate in the survey as possible.
Ultimately, the survey received 863 responses from different IP addresses (which were not tracked or recorded, but filtered only for non-repetition of the survey).
These responses came from 61 different countries, including:
North America: Canada, United States, Mexico, and Panama;
South America: Columbia, Peru, Brazil, Uruguay, Argentina, Chile;
Europe: Iceland, Ireland, UK, France, Germany, Belgium, Netherlands, Denmark, Norway, Sweden, Finland, Poland, Spain, Portugal, Italy, Slovenia, Austria, Czech Republic, Slovakia, Hungary, Serbia, Romania, Greece;
Africa: Morocco, Ghana, Egypt, Uganda, Kenya, South Africa;
Asia: Turkey, Lebanon, Israel, Iran, Pakistan, India, Nepal, China, Thailand, Cambodia, Indonesia, Philippines, Russia, South Korea, Japan; and
Australia and New Zealand.
The survey had a 92% completion rate. An additional 6% completed more than 75% of the survey, but needed to stop due to length of the survey. 1% had to stop the survey because of triggers. The final 1% did not complete the survey and did not explain why.
RESULTS
PAGE ONE: Clarifying Material and Consent to the Survey
Only participants who answered “Yes” to the first seven questions (see above) were included in the results below.
PAGE TWO: Demographics
Participant countries were listed above.
In regards to identified gender:
54% identified as female;
9% identified as male;
9% identified as non-binary;
8% identified as trans male;
4% identified as gender queer;
3% identified as trans female;
2% identified as gender fluid;
2% identified as non-conforming;
1% identified as gender variant; and
1% identified as questioning.
4% listed “other” as their identified gender, and reported that they did not want to answer.
“Female” and “Trans female” as well as “Male” and “Trans Male” were included separately not to divide the genders (“female” and “trans female” being the same gender, and “male” and “trans male” being the same gender), but simply to clarify experiences in everyone’s request for their journey to be included and reflected.
The remaining percent were decimals in the above percents, as will also be the case with the remaining results below.
In regards to the actual body age, people reported that":
43% were ages 25-34;
20% were 18-24;
16% were 35-44;
13% were 45-54;
2% were 55-64; and
1% was over 65.
We would suggest that the online platforms provided access to younger populations not usually included in research studies. We would also suggest that the online platforms were more accessible to those who are in rural areas and in other geographic locations not usually available to participate in research studies.
In regards to the participants’ fathers’ education:
26% had high school education only;
21% had graduate level education;
20% had bachelor’s level education;
17% had some college but no degree;
7% had an associate’s degree; and
6% did not complete high school.
In regards to the participants’ mothers’ education:
25% had a high school degree only;
18% had some college but no degree;
18% had a bachelor’s degree;
14% had a graduate level education;
11% had an associate’s degree; and
11% did not complete high school.
For participants themselves:
35% have some college education but no degree;
22% have a bachelor degree;
16% have a high school degree only;
11% have a graduate degree;
9% have an associate’s degree; and
4% have not finished high school.
For context, remember that 20% of the participants were in the age group of 18-24; however, that said, more participants have finished high school than their parents. More have some college, even if they have not finished a degree. More have associate’s degrees than their fathers. More have bachelor’s degrees.
Of these, in regards to how their trauma histories impacted their educational efforts, participants reported that:
34% felt their trauma impacted their education “a great deal”;
25% felt their trauma impacted their education “a lot, but I struggled through”;
13% felt their trauma impacted their education “a lot”;
7% felt they were able to complete the education they wanted;
6% felt their trauma “moderately” impacted their education;
5% felt their education was impacted by trauma “some, but I dealt with it okay”;
4% felt their trauma impacted their education “a little”; and
1% felt their trauma did not impact their education.
As for online platforms survivors frequently use for support:
78% use Facebook;
77% use YouTube;
70% use Facebook support groups;
36% use professional and/or clinical research sites;
32% use Twitter;
28% use Podcasts;
24% use Reddit;
22% use Tumblr; and
20% use organizational sites.
As for level of functioning and assistance needed:
59% of participants reported they are not on any social security, housing assistance, or food stamps;
27% of participants reported they are on social benefits;
8% of participants reported they use social benefits, as do others in their household; and
3% of participants reported they do not, but someone else in their household does.
As for housing stability, participants reported that in the last five years:
24% have not moved;
20% have moved once;
15% have moved three times;
13% have moved twice;
7% have moved five times;
7% have moved more than ten times;
4% have moved six times;
2% have moved seven times;
2% have moved four times;
1% have moved eight times; and
1% have moved nine times.
In regards to physical care, the survey included questions about sleep, eating, and exercise.
In regards to sleep, participants reported that:
54% do not exercise at all, due either to preference or medical condition;
21% exercise twice a week;
13% exercise once a week; and
10% exercise five times a week.
No other responses were reported on that question.
In regards to eating, participants reported that:
36% eat twice a day;
24% eat three times a day;
15% eat smaller amounts four times a day;
11% eat just once a day; and
6% reported that eating is difficult, and so they leave food out and “whoever inside” just “grazes” throughout the day if and when they are able to eat something.
In addition,
34% reported they struggle to eat five to six days a week;
20% struggle to eat one to two days a week;
20% do not struggle at all to eat;
18% struggle to eat three to four days a week; and
6% do not miss meals no matter what, nor do they find it difficult to eat.
In regards to sleeping, participants reported that:
28% sleep eight hours or more a night because they have help with medication;
22% sleep six to eight hours a night without the use of medication;
24% sleep four to five hours a night without the use of medication;
21% sleep three to four hours a night without the use of medication; and
4% sleep one to three hours a night without medication.
In addition,
24% rarely have nightmares;
22% have nightmares one to two nights a week;
18% used to have nightmares, but not so much since starting therapy;
15% feel like they still have nightmares every night;
11% have nightmares three to four nights a week; and
7% have nightmares five to six nights a week.

PAGE THREE: Dissociative Experiences Scale (DES) -II
The DES was included for context of what issues participants struggle with and which populations were completing the survey. It was not used for any diagnostic purposes, nor were the results saved in anyway by specific participants. Rather, the algorithm of responses scored this page per participant but only reported in the results of the page in the percentage of participants who scored in each range. So, we were not informed of which DES score goes with which participant. We only know what percentage of each possible DES score. That was intentional, as an additional buffer for privacy since this is not a clinical research study or diagnosis in any way. Participants were not informed of their individual score, nor was this reported to us in anyway. Individual DES-II scores were not reported or disclosed to anyone in any way.
Of the participants in this survey, 89% scored above 30 on the DES-II. 6% scored between 27-30. 4% scored between 24-26. 1% of participants scored 23 or below.
The high scores were expected, due to the population receiving notice of and participating in this survey were primarily those already in treatment for or aware of their own issues of trauma and dissociation.
Please note that higher scores (30 and above) only indicate high levels of dissociation, and are not indicative of specific diagnosis in and of themselves.
Again, the inclusion of the DES-II was only as a measurement of experience in the context of this survey; no clinical interview, structured or otherwise, was part of this survey, and no diagnoses were given to any participant.
For more information about the DES-II, please visit the ISSTD website. To take an online version of the DES-II, CLICK HERE.
PAGE FOUR: Adverse Childhood Experiences (ACE)
We included the ACE questions by request of the community due to increasing discussion within the community of the physiological impact of trauma long-term.
The ACE study questions were broken down into the questions listed below, to which participants could answer “yes” or “no”. Again, a specific participant’s answers were not saved per participant, but rather as a poll for how many participants answered yes to each question. This was both in protection of people’s privacy and because the survey was not being given in a clinical setting. 4% of participants opted out of this page due to the nature of the triggering questions regarding their own trauma. Another 1% declined to participate for other unspecified reasons. The positive results endorsed by those participants who completed this set of questions are given as follows:
Did a parent or other adult in the household often or very often… Swear at you, insult you, put you down, or humiliate you?
80% YES
Did a parent or other adult in the household often or very often… Act in a way that made you afraid that you might be physically hurt?
78% YES
Did an adult or person at least 5 years older than you ever… Touch or fondle you or have you touch their body in a sexual way?
66% YES
Did an adult or person at least 5 years older than you ever… Attempt or actually have oral, anal, or vaginal intercourse with you?
52% YES
Did you often or very often feel that… No one in your family loved you or thought you were important or special?
71% YES
Did you often or very often feel that… Your family didn’t look out for each other, feel close to each other, or support each other?
70% YES
Did you often or very often feel that… You didn’t have enough to eat, had to wear dirty clothes, and had no one to protect you?
44% YES
Did you often or very often feel that… Your parents were too drunk or high to take care of you or take you to the doctor if you needed it? Or didn't for some other reasons?
36% YES
Did a parent or other adult in the household often or very often… Push, grab, slap, or throw something at you?
53% YES
Did a parent or other adult in the household often or very often… Ever hit you so hard that you had marks or were injured?
45% YES
Was your mother or stepmother: Often or very often pushed, grabbed, slapped, or had something thrown at her?
23% YES
Was your mother or stepmother: Sometimes, often, or very often kicked, bitten, hit with a fist, or hit with something hard?
15% YES
Was your mother or stepmother: Sometimes, often, or very often threatened with a gun or knife or other weapon?
4% YES
Were your parents separated or divorced?
49% YES
Did you live with anyone who was a problem drinker or alcoholic or who used street drugs?
47% YES
Was a household member depressed or mentally ill, or did a household member attempt suicide?
72% YES
Did a household member go to prison?
15% YES
It is interesting to note that 7% of participants wished the ACE questions included similar specific questions for their father or stepfather the way it does about the mother or stepmother, as this group of people reported their mothers as the or one of the primary abusers even against their father or stepfather.

PAGE FIVE: Therapeutic Experiences
This section of the survey addressed issues regarding therapeutic experiences that the Plural Community had brought up in discussion about what to include in the survey.
In asking about who was in therapy, the participants responded as follows:
58% were currently in therapy at the time;
10% were, but had to quit because their therapist didn’t “believe” in dissociation;
10% wanted to be, but have been unable to find a therapist who works with dissociation;
8% were, but had to stop when their funding was cut or insurance stopped paying for it;
4% were, but their therapist moved;
4% were not currently, but actively looking for a therapist;
3% were, but had to stop because of schedule conflicts; and
1% were not because they chose not to be in therapy.
Not one person responded that they were in therapy and it was entirely covered by insurance.
When asked about how many therapists they had thus far, participants responded that:
21% had been referred more than six times;
18% had been referred more than seven times;
18% had been referred more than twice;
16% had been referred more than three times;
11% had more than eight therapists already;
10% had more than 10 therapists already; and
only 4% have only been with one therapist.
The remainder of participants have not yet found a therapist.
When asked why they had seen so many therapists, participants responded as follows (due to multiple experiences with different therapists, participants could report more than one reason, so these percentages do not add up to 100):
48% couldn’t make a positive connection with good rapport;
39% could tell their therapist didn’t know what to do with them;
31% had to move because of related instability;
26% felt their therapist didn’t listen to them;
25% had a therapist tell them they didn’t know how to treat them;
22% felt their therapist did not believe them;
17% had a therapist who moved or left an insurance panel;
9% were abused by a therapist;
8% had a therapist who retired;
8% had schedule conflicts;
7% didn’t believe their therapist when they did get diagnosed, or got scared, and so quit therapy; and
6% left a therapist who was trying to force integration.
“Other” comments included experiences of aging out of a particular school or program, therapist not being able to handle gender identity or sexual orientation issues, being too anxious to keep appointments, finances, and being forced to report abusers.

When asked how many therapists it took before getting an accurate diagnosis, the participants responded that:
42% had seen two therapists;
39% still had gotten a proper diagnosis with just one therapist;
16% had to see four therapists;
5% saw six therapists;
3% saw more than eight therapists; and
1% saw more than fifteen therapists prior to getting an accurate diagnosis.
When asked to share their diagnosis if they felt safe doing so, the participant percentages were:
53% DID
15% were not sure;
12% waiting on results of testing or for diagnostic appointments;
8% Complex PTSD
5% PTSD
4% DDNOS
3% OSDD
When asked who did the diagnosing, participants replied that:
54% were diagnosed by a therapist;
24% were diagnosed by a psychiatrist;
23% were diagnosed by case manager or social worker;
5% were diagnosed by a doctor; and
4% were “peer-diagnosed” by a friend who referred them to a clinical professional.
When asked how they identified any experience of S/RA, participants shared that:
56% did not know what the terms were and so did not think it applied to them;
23% knew what the terms were, but also knew it did not apply to them;
7% preferred the term RA/MC (Ritual Abuse/Mind Control);
5% preferred the term (S)RA (Satanic/Ritual Abuse);
4% preferred just the general term of trafficking;
3% preferred the term RA (Ritual Abuse); and
1% preferred the term SRA/MC (Satanic Ritual Abuse / Mind Control).
It is interesting to note that not any single participant chose the more general term of “organizational abuse”, and no single participant endorsed “MC - mind control only”.
When asked about other non-trauma diagnoses:
77% also have Anxiety;
67% also have Depression;
67% have both a Dissociative Disorder and PTSD;
25% have a Panic Disorder;
19% also have OCD;
13% have also been diagnosed with Borderline Personality Disorder;
11% have also been diagnosed with a Bipolar disorder;
6% have another mood disorder diagnosis; and
3% have another personality disorder diagnosis.
When asked about their best therapeutic experiences, participants shared (they could endorse more than one):
80% said the best therapy was when the therapist was good at listening to them;
57% said it was good therapy when they felt safe;
56% said they knew it was good therapy when they got good advice;
52% said it is good therapy when they feel connected;
49% said the best therapeutic experience is when the therapist responds to others inside (alters/parts);
48% said good therapy needs a safe-feeling setting;
45% said it is good therapy when they receive comfort;
40% said it is good therapy when they gain coping skills;
38% said it’s best when they are educated about their mental health issues;
38% said the best therapeutic experience is having access to contact outside sessions WHEN policies make those boundaries clear up front;
38% said the best experience happens when the scheduling is consistent;
27% said the best experience is when they are held accountable for their progress;
27% said the best experience is being able to relax and practice relaxation strategies;
18% said it is good therapy when they get safe hugs (with permission);
13% said it is only a good therapy experience when the office staff also feel safe, both on the phone and for check-in/check-out; and
12% said it is good therapy when the therapist plays with Littles or intentionally includes them when appropriate.

When asked about the most helpful techniques their therapists use, participants responded:
87% Listening
72% Reassurance
64% Playing Together
62% Art Therapy
26% Guided Imagery
26% Psychoeducation
24% EMDR
21% Music
19% DBT
18% Meditation
16% CBT
13% Sensory Therapy
11% Sandtray Therapy
10% Horse or Pet Therapy
8% Progressive Muscle Relaxation
5% Yoga
3% Hypnotherapy
Please note that the above list is not an efficacy rating of which techniques are the most effective or produce the best results. These were simply the comfortable techniques experienced by the participant population of this survey. It does not mean any one of those is better or more helpful than another, and may reflect more frequency of use or access than quality of treatment.
When asked what made them feel NOT safe in therapy, the participants endorsed the following:
65% Not knowing how to help me;
56% Not listening to me;
39% Therapist saying my stories were too hard / too much / too intense for them;
37% Therapists refusing to talk to others inside (alters/parts);
32% Discounting my stories;
30% Therapist talking too much about their own stuff during sessions;
25% Not feeling safe with office staff or in office setting;
21% Not available outside of session;
21% Not knowing about vacations or time off ahead of time for scheduling;
20% Concerns about confidentiality;
19% Boundary violations;
18% Therapist being afraid of my insiders (parts/alters);
16% Sudden movements;
15% Rejection of Littles;
13% Touch without permission, even if it was otherwise safe/appropriate;
13% Lack of eye contact;
12% Texting or taking calls from other people during sessions;
8% Not closing the office door during sessions;
3% Deliberate triggering to prove a point, access a particular alter, or test progress;
2% Inappropriate/unwanted religious discussion; and
2% Falling asleep during sessions.
Of participants asked, 18% had been abused by a therapist.
Of these, only 4% reported it.
Of those in therapy, 82% agree with their therapist on their treatment goals. Some of these goals include:
75% Decrease in Anxiety / Panic;
72% Improved Functioning;
67% Memory Work / Specific Trauma Processing;
67% Improved Internal Communication;
66% Compassion for My Self/ves;
62% Improved Mood;
58% Improved Cooperation;
41% Decrease Lost Time;
40% Maintain Functioning;
34% Remembering;
22% Stabilization and Reduce Self-Harm Behaviors;
15% Reduce Interpersonal Drama with Outside Relationships; and
14% Accepting the Diagnosis.
When asked their therapist’s goal for therapy, participants reported:
50% Functional Multiplicity
5% Integration
Another 20% did not know what their therapist goal was or what they thought about integration or functional multiplicity.
12% did not think their therapist has ever heard of functional multiplicity.
When asked about their own goal for therapy, participants reported:
78% Functional Multiplicity
3% Integration
11% had not yet heard the term “functional multiplicity”
When asked directly if participants ultimately had some goal or vision for final or complete integration, 78% said no.
92% said they were interested in some level of functional multiplicity.
PAGE SIX: Plural Perspectives
The final questions regarding plural perspectives became more specific in regards to identifying with or despite trauma, levels of dissociation, and functional multiplicity or ultimate integration. These questions arose from the efforts at uniting the Plural community as a resource for itself, for Plurals by Plurals, while also respecting individual experiences and understanding the perspectives of the clinical community. The options for responses to these questions came from the Plural community themselves, in exploring options of self-expression as a community culture and not just a clinical diagnosis:
The questions will be listed, with the participant percentage responses following.
In regards to my trauma and dissociation, I identify as:
35% DID
27% Plural
22% Multiple
5% Dissociative
3% Traumatized
2% It’s just baggage
In regards to my trauma and dissociation, I am:
30% In the closet publicly, but have found support groups online;
19% I have told friends, but not my family;
12% Everyone knows, and I consider myself an advocate in some way;
10% I have told my friends and family, but carefully with good boundaries;
4% Everyone knows, but I am not safe enough to advocate culturally;
3% Still in the closet, but at least I “get it” and am trying to deal; and
2% So far in the closet that I still am not sure what’s going on yet.
In regards to my trauma and dissociation, coming out to myself:
64% was a huge relief because everything finally made sense;
42% brutally hard, but at least I knew what was going on;
32% was positive because I found others like me;
18% was so hard / terrifying / confusing that I still can’t even think about it yet;
14% was a good thing because I finally got help; and
7% was not a big deal.
In regards to my trauma and dissociation, coming out to others was:
37% mostly with others online who know what it’s like to be me;
29% not as big a deal as I thought it would be;
27% disappointing because I lost family or friend contacts because of it;
25% okay, and my friends were totally supportive;
24% easier with my friends than my family;
16% terrible because of the repercussions that followed;
14% dangerous, and caused me safety problems; and
13% terrifying, and totally backfired.

I believe my dissociation is:
38% Traumagenic-Adaptive (I am this way because of trauma, and still use dissociation adaptively to deal with life but not necessarily intentionally and not as part of my intentional cultural expression.)
34% Traumagenic (I am this way because of trauma.)
13% Traumagenic-Cultural (I am this way because of trauma, feel mostly in control of my symptoms, and have intentionally adapted to it as a cultural lifestyle.)
2% Endogenic (I was this way before I was born, but not because of trauma.)
1% Exogenic (I was this way since I was born or grew up this way, but not because of trauma - that I know of yet.)
There were NO people who marked the following:
0% Iatrogenic (I am this way because my therapist made me this way.)
0% Iatrogenic-SocioCognitive (I am this way because I internalized and/or copied symptoms seen in friends or online, intentionally or unintentionally.)
0% Iatrogenic-Cultural (I am this way because I internalized symptoms of others intentionally or unintentionally, but did intentionally learn/apply it as a lifestyle.)
Other responses included:
Quoigenic - mixed origin
Endogenic, but heavily and negatively impacted by trauma.
Traumagenic-Neonatal. We developed this way before we were born because our maternal unit was being abused/traumatized while we were in the womb. We were "born ready" for plurality & problems/trauma.
Traumagenic-SocioCognitive
When I was young, I tended to identify with:
65% Books
31% Teachers
31% Movies
24% Video Games
23% Science Fiction Anything
21% Comics
20% Role Playing Games
17% Caregivers
17% Role Models
This final question was included because “fictives” are being commonly dismissed from participating in treatment, and we wanted to explain how technology has impacted the use of introjects in plural systems. Here is a quote from the History of DID talk we gave last year at the 2019 PPWC Conference:
This is not 1980.
It’s been more than forty years since 1980.
More than half of your survivors were barely even born in 1980.
DID is not going to look the same, sound the same, or present the same now as it did in 1980 because those clients grew up in the 1940’s and 1950’s and 1960’s. The cause may be the same, and the process may be the same, but the presentation comes in a whole new generation - four decades later. Introjects look different, persecutors look different, and inner worlds look different. That doesn’t make any of it less valid, and it is cruel and re-traumatizing for anyone to dismiss survivors because the culture we grew up in and had access to during childhood and adolescence was different than it was almost a hundred years ago.
Respectfully Submitted, thank you.

