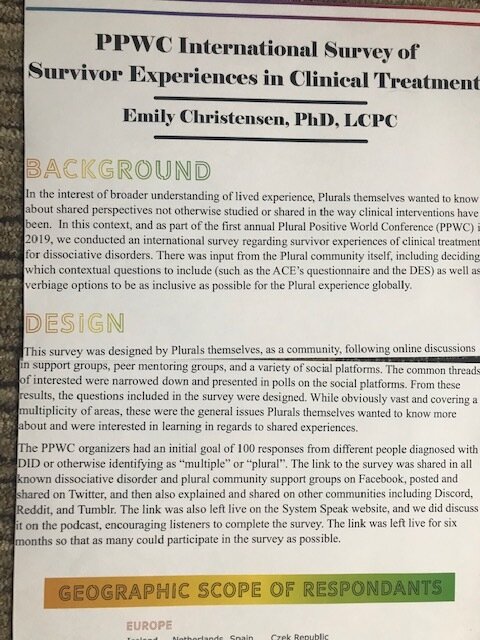
SURVEY PARTICIPATION
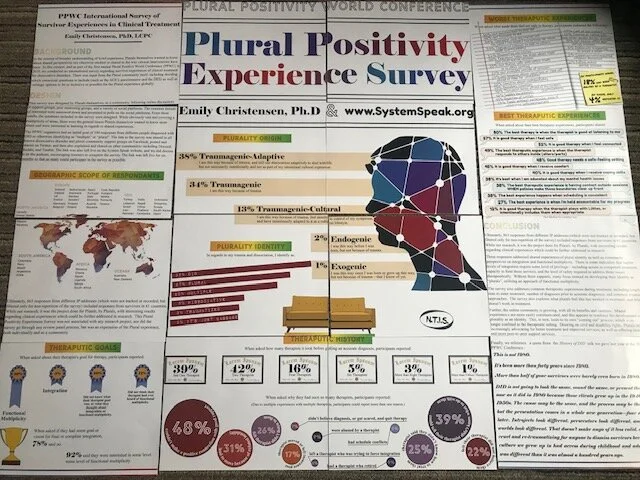
The PPWC organizers had an initial goal of 100 responses from different people diagnosed with DID or otherwise identifying as “multiple” or “plural”.
The link to the survey was shared in all known dissociative disorder and plural community support groups on Facebook, posted and shared on Twitter, and then also explained and shared on other communities including Discord, Reddit, and Tumblr.
The link was also left live on this website, and we did discuss it on the podcast.
The link was left live for six months so that as many could participate in the survey as possible.
Ultimately, the survey received 863 responses from different IP addresses (which were not tracked or recorded, but filtered only for non-repetition of the survey).
These responses came from 61 different countries, including:
North America: Canada, United States, Mexico, and Panama;
South America: Columbia, Peru, Brazil, Uruguay, Argentina, Chile;
Europe: Iceland, Ireland, UK, France, Germany, Belgium, Netherlands, Denmark, Norway, Sweden, Finland, Poland, Spain, Portugal, Italy, Slovenia, Austria, Czech Republic, Slovakia, Hungary, Serbia, Romania, Greece;
Africa: Morocco, Ghana, Egypt, Uganda, Kenya, South Africa;
Asia: Turkey, Lebanon, Israel, Iran, Pakistan, India, Nepal, China, Thailand, Cambodia, Indonesia, Philippines, Russia, South Korea, Japan; and
Australia and New Zealand.
The survey had a 92% completion rate. An additional 6% completed more than 75% of the survey, but needed to stop due to length of the survey. 1% had to stop the survey because of triggers. The final 1% did not complete the survey and did not explain why.
RESULTS
PAGE ONE: Clarifying Material and Consent to the Survey
Only participants who answered “Yes” to the first seven questions (see above) were included in the results below.
PAGE TWO: Demographics
Participant countries were listed above.
In regards to identified gender:
54% identified as female;
9% identified as male;
9% identified as non-binary;
8% identified as trans male;
4% identified as gender queer;
3% identified as trans female;
2% identified as gender fluid;
2% identified as non-conforming;
1% identified as gender variant; and
1% identified as questioning.
4% listed “other” as their identified gender, and reported that they did not want to answer.
“Female” and “Trans female” as well as “Male” and “Trans Male” were included separately not to divide the genders (“female” and “trans female” being the same gender, and “male” and “trans male” being the same gender), but simply to clarify experiences in everyone’s request for their journey to be included and reflected.
The remaining percent were decimals in the above percents, as will also be the case with the remaining results below.
In regards to the actual body age, people reported that":
43% were ages 25-34;
20% were 18-24;
16% were 35-44;
13% were 45-54;
2% were 55-64; and
1% was over 65.
We would suggest that the online platforms provided access to younger populations not usually included in research studies. We would also suggest that the online platforms were more accessible to those who are in rural areas and in other geographic locations not usually available to participate in research studies.
In regards to the participants’ fathers’ education:
26% had high school education only;
21% had graduate level education;
20% had bachelor’s level education;
17% had some college but no degree;
7% had an associate’s degree; and
6% did not complete high school.
In regards to the participants’ mothers’ education:
25% had a high school degree only;
18% had some college but no degree;
18% had a bachelor’s degree;
14% had a graduate level education;
11% had an associate’s degree; and
11% did not complete high school.
For participants themselves:
35% have some college education but no degree;
22% have a bachelor degree;
16% have a high school degree only;
11% have a graduate degree;
9% have an associate’s degree; and
4% have not finished high school.
For context, remember that 20% of the participants were in the age group of 18-24; however, that said, more participants have finished high school than their parents. More have some college, even if they have not finished a degree. More have associate’s degrees than their fathers. More have bachelor’s degrees.
Of these, in regards to how their trauma histories impacted their educational efforts, participants reported that:
34% felt their trauma impacted their education “a great deal”;
25% felt their trauma impacted their education “a lot, but I struggled through”;
13% felt their trauma impacted their education “a lot”;
7% felt they were able to complete the education they wanted;
6% felt their trauma “moderately” impacted their education;
5% felt their education was impacted by trauma “some, but I dealt with it okay”;
4% felt their trauma impacted their education “a little”; and
1% felt their trauma did not impact their education.
As for online platforms survivors frequently use for support:
78% use Facebook;
77% use YouTube;
70% use Facebook support groups;
36% use professional and/or clinical research sites;
32% use Twitter;
28% use Podcasts;
24% use Reddit;
22% use Tumblr; and
20% use organizational sites.
As for level of functioning and assistance needed:
59% of participants reported they are not on any social security, housing assistance, or food stamps;
27% of participants reported they are on social benefits;
8% of participants reported they use social benefits, as do others in their household; and
3% of participants reported they do not, but someone else in their household does.
As for housing stability, participants reported that in the last five years:
24% have not moved;
20% have moved once;
15% have moved three times;
13% have moved twice;
7% have moved five times;
7% have moved more than ten times;
4% have moved six times;
2% have moved seven times;
2% have moved four times;
1% have moved eight times; and
1% have moved nine times.
In regards to physical care, the survey included questions about sleep, eating, and exercise.
In regards to sleep, participants reported that:
54% do not exercise at all, due either to preference or medical condition;
21% exercise twice a week;
13% exercise once a week; and
10% exercise five times a week.
No other responses were reported on that question.
In regards to eating, participants reported that:
36% eat twice a day;
24% eat three times a day;
15% eat smaller amounts four times a day;
11% eat just once a day; and
6% reported that eating is difficult, and so they leave food out and “whoever inside” just “grazes” throughout the day if and when they are able to eat something.
In addition,
34% reported they struggle to eat five to six days a week;
20% struggle to eat one to two days a week;
20% do not struggle at all to eat;
18% struggle to eat three to four days a week; and
6% do not miss meals no matter what, nor do they find it difficult to eat.
In regards to sleeping, participants reported that:
28% sleep eight hours or more a night because they have help with medication;
22% sleep six to eight hours a night without the use of medication;
24% sleep four to five hours a night without the use of medication;
21% sleep three to four hours a night without the use of medication; and
4% sleep one to three hours a night without medication.
In addition,
24% rarely have nightmares;
22% have nightmares one to two nights a week;
18% used to have nightmares, but not so much since starting therapy;
15% feel like they still have nightmares every night;
11% have nightmares three to four nights a week; and
7% have nightmares five to six nights a week.